Monitoring With - Percona Monitoring and Management

In recent times, database monitoring has become a critical aspect of ensuring the smooth operation of applications and services. By monitoring databases, we can identify and resolve performance bottlenecks, optimize query performance, and proactively address potential issues before they affect users. This is why investing time in learning and working on database monitoring is a wise decision.
In this blog, you will learn about the importance of monitoring databases and how you can effectively monitor them. You will understand the various performance metrics and key indicators that you should track to keep your databases running smoothly. You will also learn about the different tools and techniques that are available for database monitoring, and how to choose the best tool for your needs.

Why PMM?
Percona Monitoring and Management (PMM) can be a valuable tool for DevOps engineers as it provides a centralized platform for monitoring the performance and health of databases. Percona Monitoring and Management (PMM), Grafana, and others. These dashboards will give you a comprehensive view of your database performance, including key metrics such as query response time, CPU usage, memory usage, and more. With this information, you will be able to quickly identify and resolve performance issues, and keep your databases running at optimal performance levels.
Here are some ways in which PMM can help DevOps engineers:
Performance Monitoring
Query Analytics
Continuous Integration and Deployment (CI/CD)
Alerting and Notification
Automated Diagnostics
What is PMM?
Percona Monitoring and Management (PMM) integrates with Prometheus and Grafana to provide a comprehensive solution for database monitoring.
Prometheus is an open-source time-series database and monitoring system that is used by PMM to collect, store, and analyze performance metrics from databases and other systems. Prometheus integrates with PMM to provide detailed performance metrics and analytics, including key metrics such as query response time, CPU usage, memory usage, and more.
Grafana, on the other hand, is an open-source visualization and analytics platform that is used to create powerful and customizable dashboards for monitoring and analyzing data. Grafana integrates with PMM to provide a comprehensive view of database performance and to allow administrators to visualize performance metrics and analytics in real time.
Together, PMM, Prometheus, and Grafana provide a complete solution for database monitoring, allowing administrators to monitor and manage their databases more effectively and efficiently. With PMM, administrators can identify performance bottlenecks, optimize query performance, and proactively address potential issues before they affect users. Additionally, the integration of PMM with Prometheus and Grafana provides a wealth of detailed performance metrics and analytics, allowing administrators to gain a deep understanding of their database performance and to make informed decisions about how to optimize and improve performance.
PMM Architecture
This runs as a twin module server and client nodes. The following diagram is an overview of the architecture.
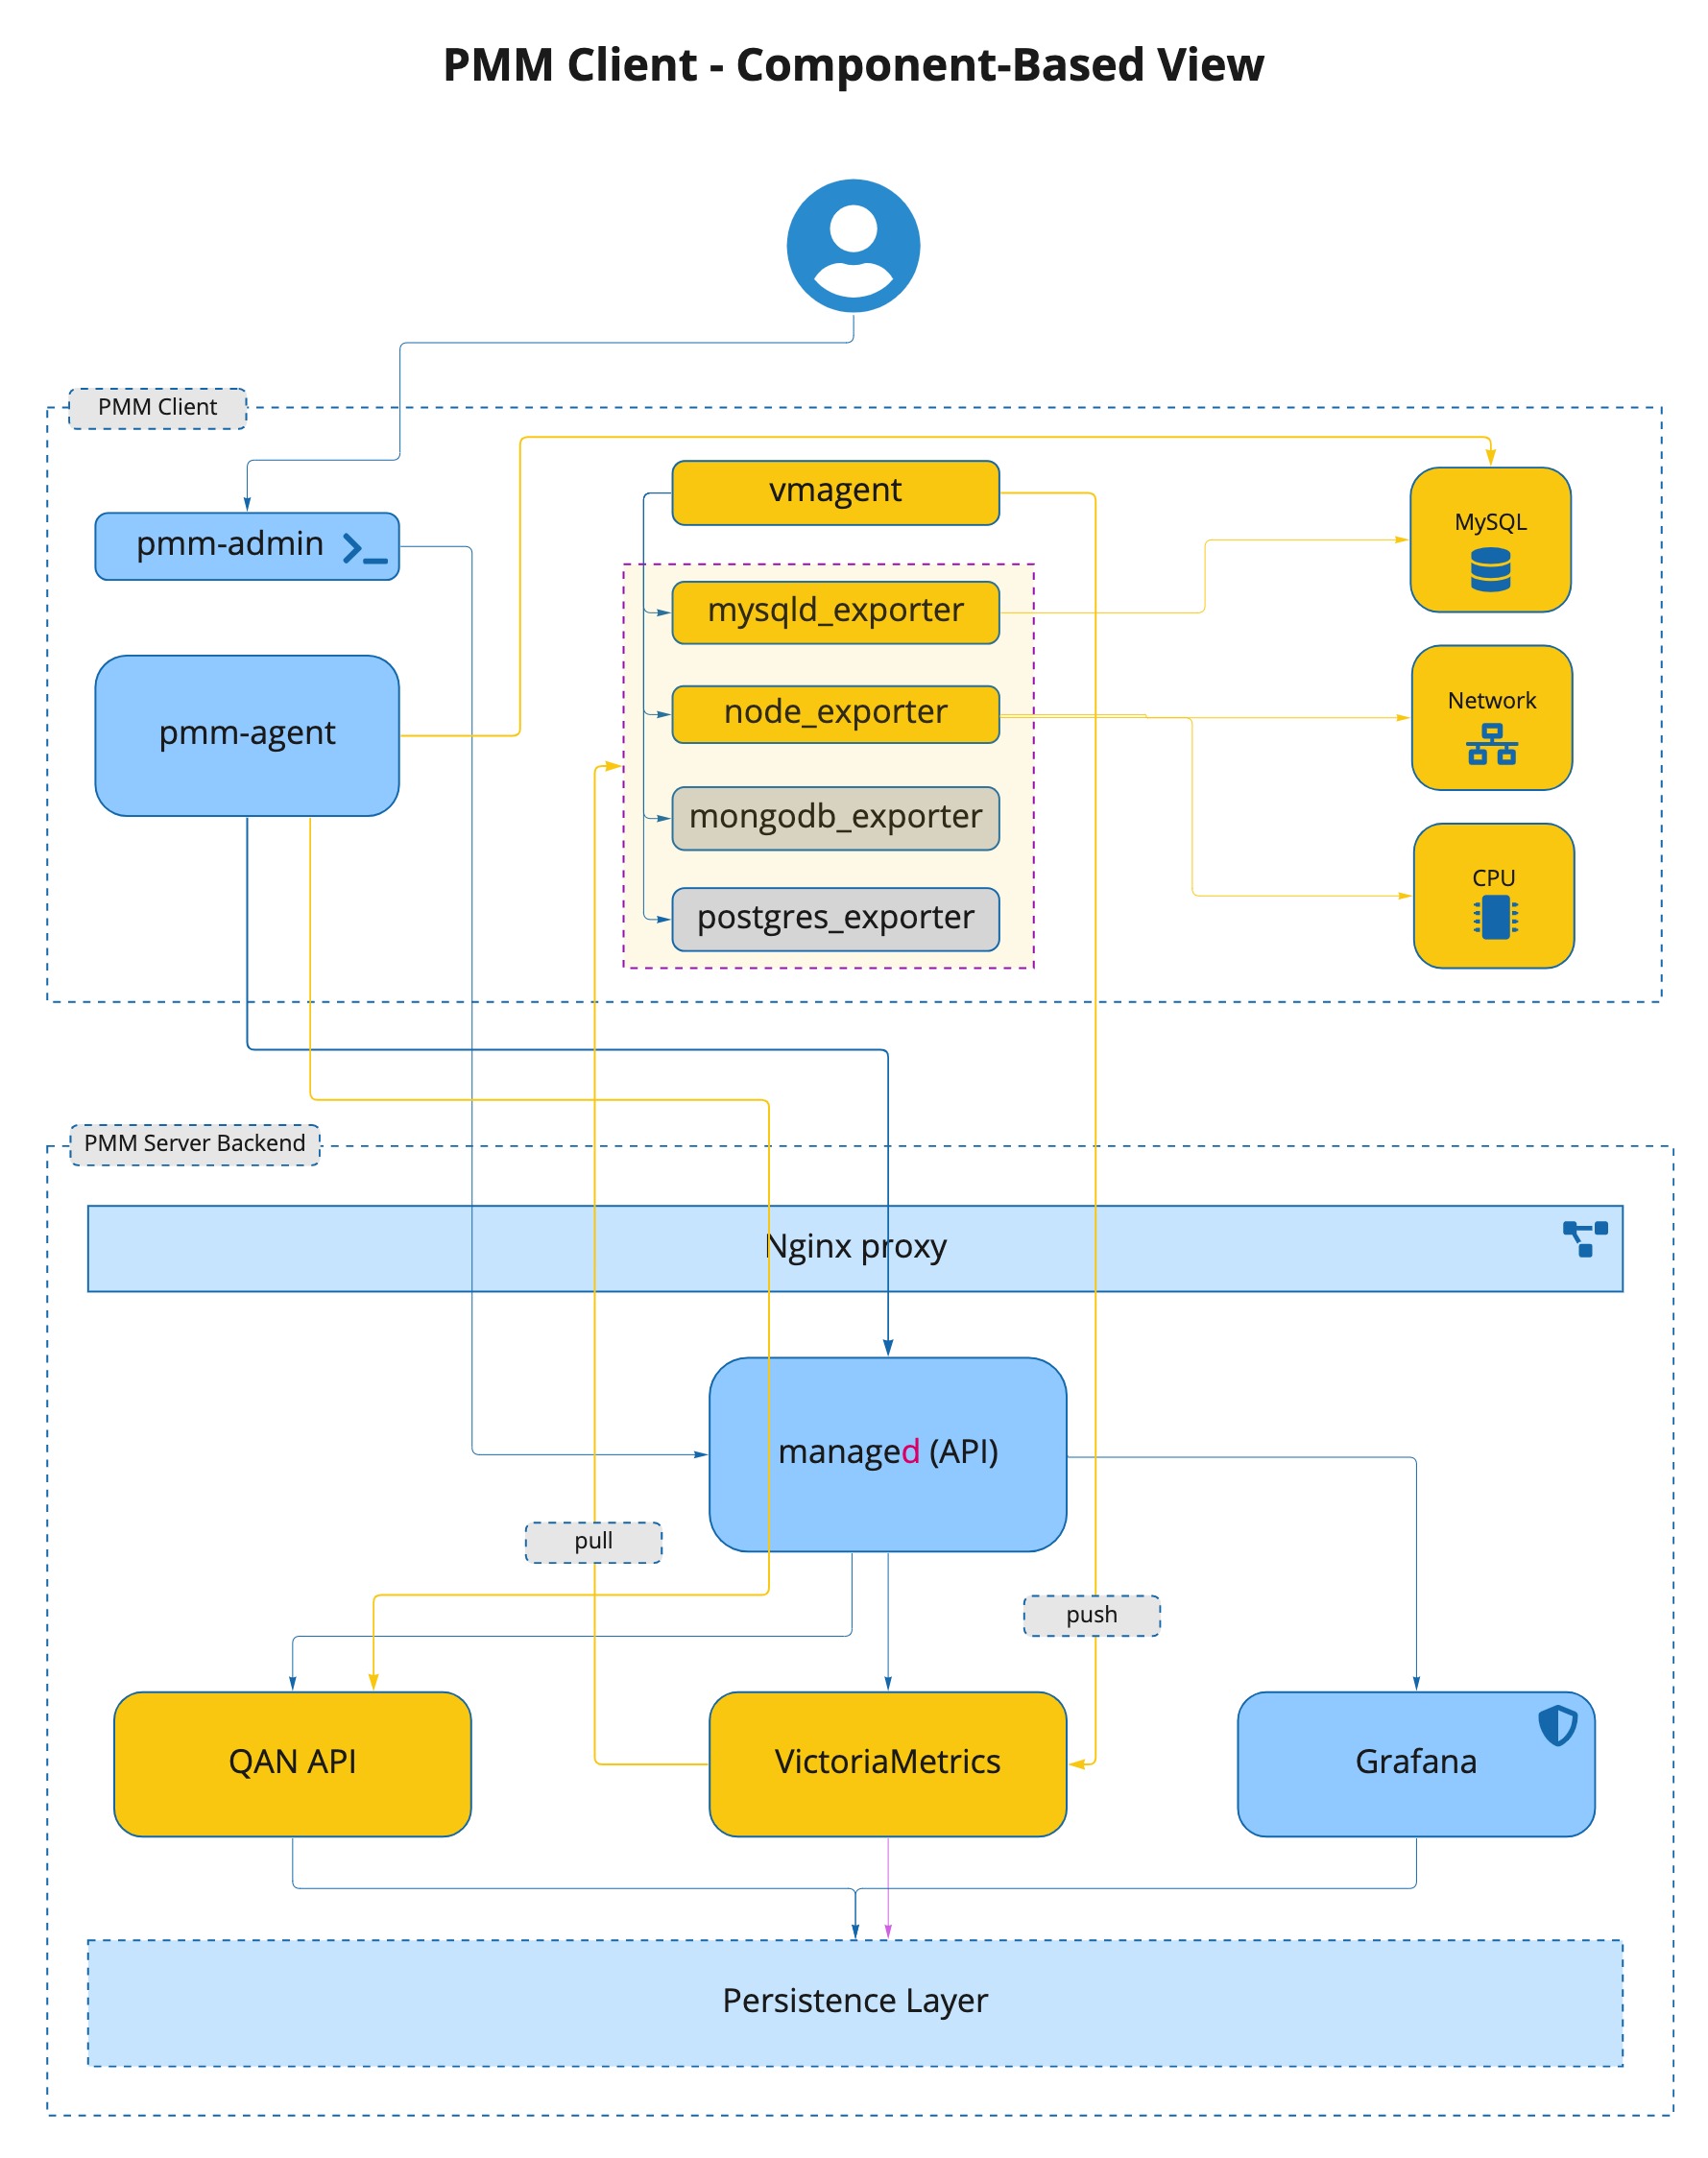
The architecture of PMM consists of two main components: the PMM Client and the PMM Server.
PMM Client:
Installed on each database instance node
Collects various performance metrics and query analytics data
Sends the collected data to the PMM Server
PMM Server:
Installed on a dedicated host, separate from the database instances
Acts as the central repository for all data collected by PMM Clients
Includes various tools such as Query Analytics (QAN), Metrics Monitor, and Grafana for visualizing and analyzing the collected data
Utilizes VictoriaMetrics, ClickHouse, and Grafana for data storage and analysis
Offers Percona Dashboards for specific insights into database performance
The PMM Client and Server communicate with each other through a secure network connection. The PMM Client continuously sends performance data to the PMM Server, which is then processed, stored, and analyzed to provide detailed insights into the performance and health of the monitored databases.
In summary, the PMM architecture provides a scalable, centralized solution for monitoring and managing databases, and offers a rich set of tools and dashboards to help you understand the performance of your databases and identify and resolve any performance issues.
PMM Server Components:
Query Analytics (QAN):
Analyzes database query performance over time
Includes QAN API for storing and accessing query data
QAN UI for visualizing collected data
Metrics Monitor:
Provides a historical view of critical metrics for MySQL/MongoDB server instances
Utilizes VictoriaMetrics, a scalable time-series database
Includes ClickHouse for facilitating Query Analytics functionality
Integrates with Grafana for data visualization
Includes Percona Dashboards for specific insights
This outlines the key components that make up the PMM Server, which provides an extensive view of database performance and query analytics. The combination of VictoriaMetrics, ClickHouse, Grafana, and Percona Dashboards allows PMM to deliver a comprehensive and easy-to-use solution for monitoring and managing your databases.
For, PMM UI components please visit here
Installation
Setting up the PMM Server
There are numbers of installation methods, please check our Setting Up documentation page.
But in a nutshell:
- Download the PMM server Docker image
$ docker pull percona/pmm-server:2
- Create the data volume container
$ docker create --volume /srv \
--name pmm-data \
percona/pmm-server:2 /bin/true
- Run PMM server container
$ docker run --detach --restart always \
--publish 443:443 \
--volumes-from pmm-data \
--name pmm-server \
percona/pmm-server:2
- Start a web browser and in the address bar enter the server name or IP address of the PMM server host.
Setting up the PMM Client
Debian-based
Configure repositories.
 wget https://repo.percona.com/apt/percona-release_latest.generic_all.deb
 dpkg -i percona-release_latest.generic_all.deb
Install the PMM Client package.
 sudo apt update
 sudo apt install -y pmm2-client
Check.
pmm-admin --version
MongoDB
Configuring MongoDB for Monitoring in PMM Query Analytics
In Query Analytics, you can monitor MongoDB metrics and queries. Run the pmm-admin add command to use these monitoring services (for more information, see Adding MongoDB Service Monitoring).
Setting Up
the Required Permissions For MongoDB monitoring services to work in Query Analytics, you need to set up the mongodb_exporter user. Here is an example of the MongoDB shell that creates and assigns the appropriate roles to the user.
db.getSiblingDB("admin").createRole({
    role: "explainRole",
    privileges: [{
        resource: {
            db: "",
            collection: ""
            },
        actions: [
            "listIndexes",
            "listCollections",
            "dbStats",
            "dbHash",
            "collStats",
            "find"
            ]
        }],
    roles:[]
})

db.getSiblingDB("admin").createRole({ "role": "pbmAnyAction",
    "privileges": [
    { "resource": { "anyResource": true },
        "actions": [ "anyAction" ]
    }
    ],
    "roles": []
 });
Create/update user and assign created roles
db.getSiblingDB("admin").createUser({
    user: "pmm",
    pwd: "pmm",
    roles: [
        { role: "explainRole", db: "admin" },
        { role: "clusterMonitor", db: "admin" },
        { role: "read", db: "local" },
        { "db" : "admin", "role" : "readWrite", "collection": "" },
        { "db" : "admin", "role" : "backup" },
        { "db" : "admin", "role" : "clusterMonitor" },
        { "db" : "admin", "role" : "restore" },
        { "db" : "admin", "role" : "pbmAnyAction" }
    ]
})
db.getSiblingDB("admin").updateUser("pmm", {
roles: [
    { role: "explainRole", db: "admin" },
    { role: "clusterMonitor", db: "admin" },
    { role: "read", db: "local" },
    { "db" : "admin", "role" : "readWrite", "collection": "" },
    { "db" : "admin", "role" : "backup" },
    { "db" : "admin", "role" : "clusterMonitor" },
    { "db" : "admin", "role" : "restore" },
    { "db" : "admin", "role" : "pbmAnyAction" }
]
})
Set profiling in the configuration file
Edit the configuration file (usually
/etc/mongod.conf).Create or add this to the
operationProfilingsection. (Read more.)operationProfiling: mode: all slowOpThresholdMs: 200 rateLimit: 100 # (Only available with Percona Server for MongoDB.)Restart the
mongodservice. (Example forsystemd.)systemctl restart mongod
Add service
Use pmm-admin to add the database server as a service using one of these example commands.
When successful, PMM Client will print MongoDB Service added with the service’s ID and name. Use the --environment and -custom-labels options to set tags for the service to help identify them.
sudo pmm-admin add mongodb --environment=prod --replication-set=prod-rs --cluster=prod-cluster --username='pmm' --password='password' --query-source=profiler --service-name=mongodb-node --host=172.23.3.54 --port=27017
On the command line
Look for your service in the output of this command.
pmm-admin inventory list services --service-type=mongodb
Remove Service
pmm-admin remove mongodb SERVICE_NAME
If you liked this article, please share it with your social networks,
Any feedback or constructive criticism is welcomed. You can either find me on Twitter @Rishavmehraa


